Mapping Infrastructure
An architecture for the five-layer data pipeline — ingest, normalize, enrich, store, serve — that turns the liminal web's scattered ecosystem maps into computable infrastructure: the data foundation beneath the kind of protocol-and-project mapping OpenHaven's Navigator surfaces.
Data Sources · Automation Pipeline
1. Overview
This document describes an architecture for ingesting, normalizing, enriching, storing, and serving data from the liminal web, regenerative movements, civic renewal efforts, and adjacent ecosystems. It is intended to support a range of applications wherein users need to see maps with geographic and project-oriented data. A note on scope: this document describes a technical architecture and a set of use cases. It is not a theory of change. The causal pathway from data infrastructure to coordination outcomes requires a human facilitation layer that this document does not fully model — that question is addressed in the companion documents listed in Section 6.1
OpenHaven’s own Navigator and Matrix — a comparative catalog of 200+ protocols, platforms, and tools across the decentralized and peer-to-peer technology ecosystem — is one of the primary data sources this architecture is built to serve, and the clearest illustration of what the pipeline is for. From a data perspective, a project like OpenHaven requires technology entity data (protocols, platforms, tools, and projects with structured attributes: maturity, license, capabilities, governance model), conceptual framework data (the theoretical and taxonomic structures that make categorization meaningful), people and organization data (developers, maintainers, communities, and funders), and conceptual interconnections (how technologies relate to each other — implements, extends, competes with, complements).
Read alongside the broader directory of maps and tools surveyed below, this points at a more general aim: combining OpenHaven’s own matrix and navigator data with the wider set of ecosystem maps and automation tools cataloged in this document to build the discovery frameworks, automations, and connection mechanisms that a fragmented ecosystem currently lacks. Followed further, that aim points toward something more ambitious and more distant: decentralized, open protocols that could replicate some of what centralized search engines and AI chatbots do today — discovery, retrieval, recommendation, connection — without the single point of control. This document is not that protocol, and building one would be a genuinely hard, multi-year undertaking. But the data architecture described here — a common way of ingesting, normalizing, and serving structured information about people, organizations, projects, and technologies — is close to a precondition for it, and can be read as an early, partial draft toward the kind of specification that effort would eventually need.
The foundation of this architecture is a curated directory of 60+ ecosystem maps, data sources, automation tools, and categorization schemas compiled through the liminal web ecosystem networking and mapping research project originally sponsored by the Institute of Applied Metatheory. This document provides a systematic analysis of which items in that directory are actionable data sources, what automation tools offer the most value, how these relate to specific use cases, and how the full pipeline can be built and maintained.
| Key Framing | This architecture treats the ecosystem maps not as visualizations but as data sources — structured or semi-structured collections of information about people, organizations, projects, technologies, conceptual frameworks, and places that can be extracted, unified, and made computable. |
|---|
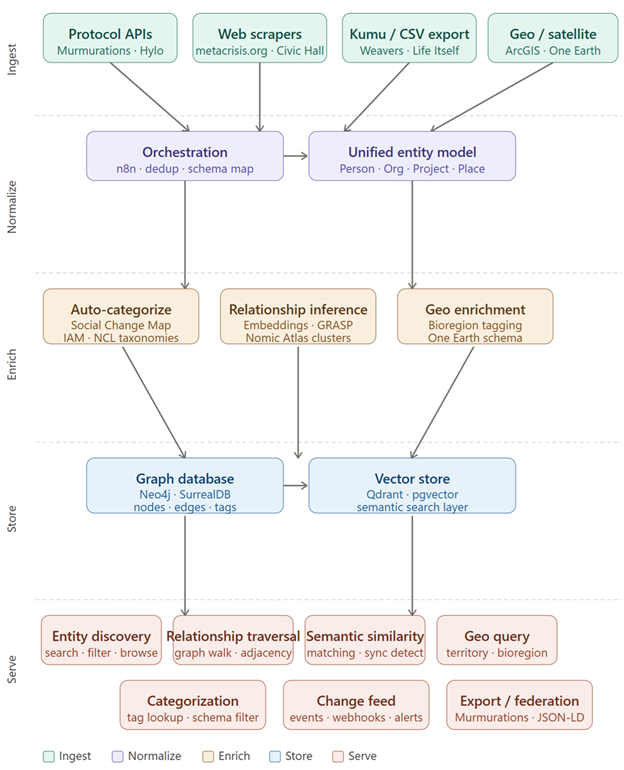
The architecture is organized into five layers:
- Ingest — pulling data from external sources through APIs, scraping, manual export, and protocol-native harvesting
- Normalize — deduplicating and mapping heterogeneous data into a unified entity model
- Enrich — applying categorization schemas, relationship inference, and geographic tagging
- Store — persisting normalized and enriched data in graph and vector databases
- Serve — exposing the data through functions that support civic coordination, technology mapping, network intelligence, and community engagement
The diagram below shows the overall pipeline structure.
2. Core Use Cases
The infrastructure is designed to serve four intersecting use cases. Understanding these use cases is essential context for evaluating which data sources and tools are worth prioritizing.
2.1 Catalyzing Civic Engagement
A primary application demonstrates how this infrastructure catalyzes democratic resilience and community flourishing. Community organizations focused on civic engagement, sensemaking, and democratic participation operate scattered across cities and regions, each developing valuable practices but unable to coordinate effectively. Leaders become overwhelmed trying to manage their own hub while also building relationships with peers.
With this mapping infrastructure, these organizations become visible as a coordinated network. Civic hub coordinators can:
- Identify gaps where new hubs are needed
- Connect organizations with complementary capabilities for joint programs
- Share successful strategies adapted to local contexts
- Track impact across individual skill development, community trust-building, and institutional strengthening
- Demonstrate collective impact to funders supporting democratic resilience
This model creates multiplier effects: as communities develop stronger sensemaking and civic leadership, every other civic initiative becomes more effective. We build the relational and developmental infrastructure that strengthens the entire ecosystem.
A prior question is worth naming: several ecosystem maps covering civic organizations already exist, including the NCL Healthy Democracy Ecosystem Map, Catalist, and Hylo. The coordination gaps described here have persisted despite those resources. This infrastructure is most likely to produce the effects described above when combined with active facilitation — someone whose role is to act on the visibility the data provides, not merely to maintain it.2
2.2 Optimizing the Regenerative Ecosystem
A vital application demonstrates how this infrastructure transforms fragmented regenerative initiatives into coordinated bioregional movements. Regenerative organizations working on soil restoration, watershed management, food sovereignty, and ecosystem renewal operate in isolation despite addressing interconnected ecological and social systems. We might find a permaculture collective developing regenerative agriculture practices while a watershed council works on riparian restoration, a food hub builds local supply chains, and a land trust protects critical habitat. These might all operate within the same bioregion with limited awareness of potential synergies — though in many cases the coordination failure is less about discovery than about resource competition, governance incompatibility, or different theories of land stewardship that visibility alone does not resolve.3
With this mapping infrastructure, these initiatives become visible as an integrated regenerative ecosystem. Coordinators can:
- Map organizational capabilities against bioregional needs, revealing gaps in coverage
- Connect regenerative farmers with land trusts holding suitable properties
- Link ecological restoration projects with educational institutions needing field sites
- Coordinate supply chains connecting regenerative producers with mission-aligned distributors and consumers
- Demonstrate collective impact to funders supporting regenerative development and climate resilience
This creates bioregional coherence, as restoration efforts align with watershed boundaries, economic flows support ecological health, and land stewardship integrates indigenous knowledge with contemporary science. We build the coordination infrastructure that enables regenerative systems to function as living networks rather than isolated projects.
2.3 The Creation of Global Action Networks
A transformative application demonstrates how this infrastructure enables the emergence of coordinated global action networks (GANs) to address civilizational challenges. A GAN brings together a range of entities and institutions covering the governmental, nonprofit, and private sectors to collaboratively work to address critical issues whose impact transcends geography.
Throughout the world, there are people working on important initiatives who recognize the need for responses that adequately match the scale and interconnection of global threats and crises, including climate disruption, democratic erosion, technological transformation, and (dis)information overwhelm. However, efforts to build global coordination fail repeatedly because they either impose top-down structures that ignore local contexts or they remain purely aspirational networks without operational infrastructure.
Established organizations pursuing integrative approaches, including the nascent metamodern movements, integral communities, regenerative networks, systems change initiatives, operate in parallel without sufficient awareness of complementary efforts or mechanisms for strategic coordination. Each develops partial solutions within their worldview frame, unable to discover how their perspectives integrate with others or how coordination could create civilizational-scale impact.
We can see major institutions, which would include universities, international NGOs, forward-thinking corporations, and innovative governmental agencies, recognizing that conventional approaches are failing. Despite the evidence of failure of the status quo, these entities lack frameworks for engaging with emerging integrative movements. These institutions possess substantial resources, established credibility, and implementation capacity but operate within outdated worldview assumptions. The mapping infrastructure creates a bridge: institutions can discover and engage with integrative initiatives that demonstrate viable alternatives and grassroots movements can gain access to institutional resources and scaling capacity. This enables a crucial transition where institutions not only fund alternatives but are actively participating in coordinated networks. This utilizes the immense capabilities of institutions while evolving their own worldview assumptions through authentic collaboration with the emergent initiatives and their next-generation ideas.
This use case represents the longest causal chain in the document and should be understood as a long-horizon aspiration rather than a near-term output of the infrastructure. The Waddell GAN framework cited in Section 5.6 documents networks that emerged from sustained relational work over years, not from improved data discoverability. The infrastructure described here can support that work; it cannot substitute for it.4
2.4 Addressing Systemic Problems and Crises
A critical application demonstrates how this infrastructure enables coordinated responses to civilization-scale challenges by connecting leverage points with actors capable of using them.
Organizations, foundations, government agencies, and research institutions recognize that climate disruption, democratic erosion, and economic inequality are interconnected systemic challenges. However, these entities tend to operate within a particular domain without clear visibility into how their work connects to root causes or how coordination with other domains could amplify their impact.
With this mapping infrastructure, these actors discover their complementary leverage points. To give some examples: A foundation funding community journalism would connect with researchers studying economic incentive structures and technology developers who are building prosocial alternatives. An environmental organization links their regenerative agriculture work to economic development agencies, educational institutions teaching ecological literacy, and policy organizations addressing ownership structures that require extraction.
The platform makes root cause analysis actionable by showing:
- Which interventions are framed as addressing causes versus symptoms by the actors and schemas represented in the data5
- What leverage points each organization controls
- Who else is working on interconnected challenges where coordination creates multiplier effects
This transforms isolated symptom management into coordinated root cause intervention, demonstrating to funders and policymakers that systemic challenges require - and can achieve - systemic responses.
This use case would likely be connected with the Strategic Metacrisis Mapping Initiative, which is a partnership between the Institute of Applied Metatheory and Eudaimonia Institute. Another possible connection would be with the metacrisis research being conducted by CRI.
2.5 Funder Transparency and Multi-Dimensional Impact Measurement
A critical enabling application demonstrates how this infrastructure addresses one of the most persistent failures in philanthropic and impact investment: the inability to verify whether resources are producing meaningful, multi-dimensional change and to communicate that clearly to the people providing them.
Individuals and institutional funders who are considering supporting projects within the liminal web, the regenerative ecosystem, and the broader metacrisis response space face a fundamental problem: they are being asked to fund largely non-institutional, network-based initiatives whose impact is diffuse, relational, and resistant to conventional single-metric measurement. Funders often cannot see how their contributions connect to outcomes, who else is funding complementary work, or whether the network as a whole is moving in a coherent direction. This opacity is a significant barrier to mobilizing the capital these initiatives need.
With this mapping infrastructure, funders gain a multi-dimensional, real-time view of the ecosystem they are supporting. This includes:
- Portfolio visibility — all funded entities surfaced in one view, with their relationships to each other and to broader network goals
- Contribution traceability — a clear, auditable record of where funding flows and which activities it supports
- Relational impact — how funded organizations are connected to and catalyzing activity in adjacent parts of the network, surfacing multiplier effects that single-org reporting misses
- Multi-dimensional indicators — progress tracked across developmental, ecological, civic, and social dimensions simultaneously, not collapsed into a single metric
- Comparative context — how funded initiatives compare to similar efforts in terms of reach, depth, and network centrality
- Longitudinal tracking — how the ecosystem is changing over time as a result of coordinated investment
Delivering this capability requires extending the data model and pipeline in specific ways:
- Impact event logging — a structured log of activities, outputs, and outcomes associated with each entity, linked to the entities’ records in the graph
- Multi-dimensional indicator schema — a framework for categorizing impact across dimensions (e.g., individual development, community trust, ecological restoration, institutional change). Several categorization schemas in the directory are relevant here, including the IAM metacrisis response ecology taxonomy and the NCL Healthy Democracy schema.
- Funder-entity relationship model — explicit representation of funding relationships in the graph, including amounts, timeframes, and purposes, with appropriate privacy controls
- Aggregation functions — the ability to roll up impact data from individual entities to portfolio, network, and ecosystem levels
- Narrative layer — structured space for qualitative context alongside quantitative indicators, since much of what matters in this ecosystem resists reduction to numbers
For additional information, see the companion document Peerfunding and Common-Based Finance Guide.
2.6 Digital Identity, Proof of Personhood, and Accountable Contribution
A foundational enabling layer supports all other use cases by solving a problem that becomes increasingly acute as the infrastructure grows: knowing that the people and organizations represented in the graph are who they claim to be, and that contributions — of funding, knowledge, labor, and governance participation — are genuinely tied to real, distinct humans rather than bots, duplicate accounts, or pseudonymous actors who cannot be held accountable. An important architectural consideration is how this mapping infrastructure would integrate with digital identity systems, including proof of personhood. This is particularly relevant when the infrastructure is used for funder accountability (Section 2.5), participatory governance, needs/offers matching, and any context where trust and verifiability matter.
Open network infrastructure of the kind described in this document has historically struggled with identity in two opposing ways: either it collects too much personal data, creating privacy and surveillance risks, or it collects too little, enabling Sybil attacks, misrepresentation, and the erosion of trust. A third path — verifiable, privacy-preserving digital identity — has become technically feasible through the convergence of decentralized identifier (DID) standards, verifiable credentials (VCs), and zero-knowledge proof systems.
3. Data Source Analysis
The following analysis organizes the 60+ items in the directory into categories and evaluates each data source for its usefulness, access method, and relevance to the core use cases above. Items that are purely directories of other maps, or that are primarily illustrative rather than data-rich, are noted but deprioritized. Note that the directory contains additional information and links to the respective websites for each.
3.1 Tier 1 — High-Value Data Sources
These sources contain substantial structured or semi-structured data directly relevant to one or more core use cases. They should be prioritized for early integration.
| Source | Producer | Entity Types | Access Method |
|---|---|---|---|
| Second Renaissance Ecosystem Map | Life Itself | People, Orgs, Projects, Media | Airtable API or CSV export (underlying platform); Cohere embed JSON |
| Meta-Crisis Meta-Resource | Sloww | People, Orgs, Projects, Media | Static HTML scrape (Obsidian-published vault, consistent structure) |
| Healthy Democracy Ecosystem Map | National Civic League | Orgs, Political entities, Land-based | Web scrape + partnership outreach; NCL publishes structured reports |
| P2P Foundation Wiki | Michel Bauwens | People, Orgs, Projects, Tech, Conceptual | MediaWiki API (api.php endpoint, openly licensed) |
| Hylo | Terran Collective | People, Orgs, Projects, Land-based | GraphQL API (open source, documented) |
| Weavers Social Trust Map | Weavers | People, Projects, Land-based, Political | Kumu JSON export (public embed URL) |
| Big Map to Save the Future | Jon Schull | People, Orgs, Projects, Land-based | Web scrape + possible direct data partnership |
| Conscious Change Collective | The Garrison Institute and Circles for Conscious Change | Orgs, Worldviews | Kumu JSON export (public embed URL) |
| Catalist | Catalist | People, Orgs, Projects, Frameworks | Platform API (partner inquiry needed) |
| Civic Tech Guide | Civic Hall | People, Projects, Tech, Political entities | Structured HTML scrape |
3.2 Tier 2 — Specialized or Domain-Specific Sources
These sources are valuable for specific layers or use cases but are not broad enough or accessible enough to be first-priority integrations.
| Source | Producer | Domain | Access Method |
|---|---|---|---|
| Restor | Restor | Land-based projects, bioregions | Public API (documented) |
| One Earth Bioregion Map | One Earth | Land-based, bioregions | Mapbox data layers (public) |
| Planetary Portal | Berggruen Institute | Organizations (global governance) | Web scrape |
| NooNAO | Brad de Graf | People, Orgs, Projects, Bioregions | Partnership (WWW working group connection) |
| Thaumazo Community Mycelium | Daniel Lindenberger | People, Orgs, Projects, Bioregions | Partnership outreach |
| Web3 Meta-Crisis Wiki | Benjamin Life | Technologies | Static HTML scrape (GitHub Pages) |
| Decentralized Tech Ecosystem Map | Christina Bowen | Technologies | Kumu JSON export |
| ReFi Ecosystem | ReFi DAO | People, Orgs, Projects | Web scrape / possible API |
| Gaianet Ecosystem | Gaianet | People, Orgs, Projects, Tech, Media | Web scrape |
| SuperConnector | MIT | People, Projects | API (automation-capable per directory) |
| Global Ecovillage Map | Kosha Joubert | People, Orgs, Land-based | Web scrape (GEN map platform) |
| Standingwave Bioregional | NooNAO / Standingwave | Land-based, bioregions | Mapbox embed + partnership |
| ICmatch | Ardell Broadbent | Connecting IC cofounders for land-based projects | Partnership outreach and FB marketing to IC groups |
3.3 Categorization Schemas
These items do not contribute entity data but provide taxonomic frameworks that can be applied to classify existing entities. They are used in the Enrich layer of the pipeline.
| Schema | Producer | What It Classifies | Application |
|---|---|---|---|
| The Social Change Map | Deepa Iyer | Organizations, people (by movement role) | Apply to all org/person entities — assign roles: builder, disruptor, healer, weaver, etc. |
| Mapping an Ecology of Integrative Approaches | Nørgaard, Hedlund, Meglin (IAM) | Organizations, projects (by integrative approach) | Apply to liminal web and metacrisis-oriented entities — provides nuanced categorization aligned with IAM ecosystem |
| Wisdom Age | Roote | Worldviews | Tag entities by worldview affiliation or orientation |
| Healthy Democracy Ecosystem Map schema | National Civic League | Civic organizations | Classify civic orgs into NCL’s healthy democracy taxonomy |
| Planetary Portal schema | Berggruen Institute | Global governance organizations | Classify orgs operating at global/institutional scale |
| Context (IAM) | Institute of Applied Metatheory | Conceptual frameworks and interconnections | Apply IAM’s framework taxonomy to conceptual entities; potential for AI-assisted classification |
| Connectioning | J. Friday | Organizations / network actors | Categorization schema with automation support — evaluate for use in relationship typing |
| Conscious Change Collective | The Garrison Institute and Circles for Conscious Change | Social issues, types of communities served, inner work modalities, faiths, organization role | Offer connections between organizations doing conscious change work and organizations doing complementary work in other domains such as regen agriculture, infrastructure development, community organizing, etc. |
3.4 Protocol-Native Sources
Murmurations deserves separate treatment from the sources above. It is not merely a data source but a protocol — a standard by which organizations self-publish structured profiles at predictable URLs, and a network index that harvests those profiles. This means:
- As an ingest source, Murmurations provides a continuously updated feed of profile data from organizations that have self-published — no scraping required.
- As a publishing mechanism, applications and platforms can publish Murmurations profiles, making them discoverable to the entire network.
- The Murmurations index API allows filtered queries by field, location, relationship type, and schema. This bidirectionality — ingesting from and publishing to the same protocol — makes Murmurations uniquely valuable for a federated infrastructure. It should be one of the first integrations implemented.
3.5 Sources to Deprioritize
The following items from the directory are either directories of other maps (already accounted for), primarily illustrative/educational, or too difficult to extract structured data from at this stage:
- An Overview of Second Renaissance Ecosystem Mapping Efforts (Life Itself) — directory of directories; useful for discovery but not an ingest source
- The Flourishing of All Living Things (Naryan Wong) — directory of maps
- Grassroots Network of Networks (Michael Haupt) — Roam-based; structured extraction difficult without owner cooperation
- Jerry’s Brain (Jerry Michalski) — rich but idiosyncratic; high curation cost per entity
- Wisdom Wayfarer (Patrick Barry) — Google Sites; primarily illustrative
- Joe Lightfoot’s Liminal Web Map — blog post with embedded image; low structural value as data source
- Memetic Tribes of Culture War 2.0 — Google Sheet with worldview data; useful as reference but limited scope
- Mapping the Noosphere (Human Energy) — primarily visualization, limited structured data
- Encyclopedia of Big Pictures (IAM/ARC) — in development; integrate when available
4. Automation Tool Analysis
The directory includes a number of items with automation capabilities. The following analysis evaluates each for its role in the infrastructure pipeline, its cost profile, and its priority for implementation.
4.1 Pipeline Orchestration
n8n
n8n is an open-source workflow automation platform with a visual node editor, support for HTTP requests, webhooks, schedules, databases, and conditional logic. It is the recommended backbone for the ingest and normalize layers of this pipeline.
- Use cases: Schedule data pulls from APIs and scrapers; trigger normalization and deduplication jobs; route enrichment workflows; send alerts when new entities are detected; coordinate batch classification runs
- Cost: Free when self-hosted; cloud plan available for managed deployment
- Priority: High — implement first
Alternative: Make (formerly Integromat) offers similar functionality with a more polished UI but a paid model. It may be preferable for teams less comfortable with self-hosting. A second alternative is Apache Airflow, which is more powerful for complex DAG-based pipelines but requires more DevOps overhead.
4.2 Embedding and Semantic Intelligence
Nomic Atlas
Nomic Atlas is a platform for building navigable maps of large datasets using embeddings. It accepts structured records, computes vector embeddings, and enables semantic clustering and similarity search. It is the recommended tool for the relationship inference and synchronicity detection components of the Enrich layer.
- Use cases: Embed entity descriptions to enable semantic similarity search; cluster entities into thematic neighborhoods; surface hidden affinities between entities that are not explicitly linked
- Cost: Free tier available for small-medium datasets; paid for larger collections
- Priority: High for regenerative and civic engagement adjacency discovery features; medium for OpenHaven
Alternatives: A self-hosted vector database (Qdrant, Chroma, or pgvector) combined with an open-source embedding model (e.g., sentence-transformers) provides the same capability at lower cost with greater control. This is the recommended path if data privacy is a concern or if the dataset grows large.
4.3 Graph Visualization and Traversal
Kumu
Kumu is a relationship mapping tool used by several sources in the directory. It is already embedded in the ecosystem and supports JSON import/export, making it useful both as an ingest source (pulling data from Kumu-based maps) and as a visualization layer (rendering the graph for human exploration).
- Use cases: Publish human-navigable views of the entity graph; accept JSON exports from partner maps; provide an accessible interface for non-technical community members
- Cost: Free for public projects; paid for private maps
- Priority: Medium — useful as a visualization front-end but not required for the core pipeline
HuViz
HuViz is an open-source RDF graph visualization tool. If the storage layer exposes a SPARQL endpoint, HuViz can serve as a zero-cost public-facing traversal interface for the conceptual interconnections graph.
- Use cases: Public exploration of conceptual framework relationships; RDF/linked data visualization
- Cost: Free (open source)
- Priority: Low-medium — relevant if RDF/SPARQL is adopted for the conceptual layer
4.4 Geographic and Territorial Intelligence
ArcGIS
ArcGIS provides geospatial data layers, mapping APIs, and analysis tools. It is relevant for the bioregion and land-based project layers of the data model.
- Use cases: Bioregion polygon data; geographic enrichment of land-based entities; territory visualization
- Cost: ArcGIS Online has a free tier with public data access; full platform is expensive. Consider using free alternatives (QGIS, OpenStreetMap, One Earth data layers) for core functionality
- Priority: Medium for territory/bioregion use cases; evaluate free-tier coverage before committing
Whole Earth Codec / Planet Labs
These tools provide satellite imagery and earth analytics. They are relevant for the most advanced territory monitoring use cases but are likely out of scope for the near term given cost and complexity.
- Priority: Low — defer until land-based use cases are more developed
4.5 Knowledge Graph and Conceptual Mapping
Obsidian and Roam
Both tools appear in the directory as automation-capable knowledge graph environments. In the context of this infrastructure, they are most useful as contributor-facing authoring tools — team members and community contributors can maintain structured notes in Obsidian or Roam that are periodically exported and ingested into the main graph. The Obsidian Dataview plugin in particular enables structured queries against local vaults that can be exported as JSON.
- Use cases: Contributor knowledge management; structured export source for manual curation work
- Cost: Obsidian is free (local); Roam has a subscription. Both have community plugins for export
- Priority: Low for pipeline; medium for contributor workflow
IAM Context
Context (contextdriven.ai) is an IAM-produced platform for conceptual framework mapping and interconnection. It has both data source and automation capabilities. Given the IAM relationship, it is a natural candidate for integration — both pulling its conceptual framework data into the graph and potentially using its categorization capabilities to classify other entities.
- Use cases: Conceptual framework data ingestion; AI-assisted categorization of frameworks and ideas
- Cost: Evaluate through IAM partnership
- Priority: Medium — coordinate with IAM on integration terms
4.6 Automation Tools to Deprioritize
The Omni Mapping Project (Buckminster Fuller Institute) and PLAN Systems both have automation capabilities listed, but their specific APIs and integration paths are not well-documented in public sources. These should be monitored but not prioritized for early implementation.
5. Pipeline Architecture
The architecture is organized into five layers. Each layer has a defined set of inputs, transformations, and outputs. The layers are designed to be implemented incrementally — a minimal viable pipeline can be built with the first three layers and expanded from there.
5.1 Layer 1 — Ingest
The Ingest layer is responsible for pulling data from external sources on a scheduled or triggered basis and depositing it into a raw staging area. It does not transform or validate data — its only job is reliable retrieval.
Input streams
- Protocol-native APIs: Murmurations index, Hylo GraphQL, P2P Foundation MediaWiki API, Restor API, SuperConnector API
- Scheduled web scrapers: metacrisis.org (Obsidian HTML), Civic Tech Guide, Catalist public pages, Second Renaissance / Cohere (if Airtable direct access not available), Planetary Portal, ReFi Ecosystem, Web3 Metacrisis Wiki
- Kumu JSON exports: Weavers Social Trust Map, Decentralized Tech ecosystem map, Limicon map, and any other Kumu-based public maps
- Manual / batch imports: CSV exports from Airtable-backed maps, partner data drops, Obsidian/Roam vault exports from contributors
- Geo/satellite APIs: ArcGIS public layers, One Earth Mapbox data, Standingwave bioregion data, Restor land-based project data
Tooling options
- Option A (recommended): n8n self-hosted as the orchestration engine. n8n nodes handle HTTP requests, JSON parsing, schedule triggering, and writing to the staging database. This requires a Linux server (2+ GB RAM) with Docker.
- Option B: Make (cloud-hosted, no self-hosting). Lower ops overhead but has per-operation costs that increase with scale. Better for teams without DevOps capacity.
- Option C: Custom Python scripts managed by cron or a cloud scheduler (GitHub Actions, Fly.io, Railway). Maximum flexibility but requires engineering time to maintain.
Staging storage
Raw data should land in a simple relational staging area before normalization. A Postgres database with one table per source type works well. This provides a checkpoint — if normalization fails, raw data is preserved and the process can be re-run without re-fetching.
5.2 Layer 2 — Normalize
The Normalize layer transforms heterogeneous raw data into a unified entity model. This is the most intellectually demanding layer to design well — decisions made here determine what kinds of queries and relationships are possible downstream.
Unified entity model
The recommended entity types are:
- Person — individuals with attributes: name, roles, affiliations, geographic location, contact info, profile links
- Organization — legal entities with attributes: name, type (nonprofit, cooperative, company, informal group), sector, geographic scope, website
- Project / Initiative — bounded efforts with attributes: status, start/end dates, parent organization(s), technology stack, issue focus
- Technology — protocols, platforms, and tools with attributes: maturity, license, governance model, capabilities, ecosystem
- Conceptual Framework — published theoretical frameworks with attributes: domain, key citations, associated thinkers, application scope
- Place — geographic entities with attributes: type (bioregion, city, country, territory), coordinates, polygon, administrative hierarchy
- Media — content artifacts with attributes: type (book, podcast, video, blog), creator(s), publication date, URL
Deduplication
The hardest problem in normalization is entity resolution — recognizing that “Life Itself” in one source and “Life-Itself” in another refer to the same organization. A two-pass approach is recommended:
- Fuzzy string matching: use a library such as RapidFuzz (Python) to find candidate duplicates above a similarity threshold (e.g., 0.85). Flag these for review.
- Embedding similarity: embed entity name + description and compute cosine similarity. Entities that are textually similar but named differently will surface here.
- Human review queue: borderline cases (similarity 0.7–0.9) enter a lightweight review interface where a curator confirms or rejects the merge.
- Canonical record: confirmed duplicates are merged into a canonical record with provenance tracking — the source records are preserved and linked to the canonical.
Tooling options
- Option A: Python-based normalization scripts triggered by n8n, writing to Postgres. Uses RapidFuzz for fuzzy matching, sentence-transformers for embedding-based dedup.
- Option B: A commercial entity resolution service (e.g., Senzing, which has a free community edition) if the entity resolution problem proves complex at scale.
- Option C: LLM-assisted resolution for ambiguous cases — a structured prompt that presents two candidate records and asks whether they are the same entity. This is expensive at scale but effective for the difficult cases.
5.3 Layer 3 — Enrich
The Enrich layer adds derived attributes to normalized entities: category tags from applied schemas, inferred relationship types, geographic enrichment, and semantic embeddings.
Categorization
Each categorization schema in the directory can be applied as a batch tagging job. The process for each schema is:
- Define the schema’s categories and their descriptions in a structured prompt.
- For each entity of the relevant type (e.g., all organizations), send a classification request to an LLM with the entity’s name, description, and the schema’s category options.
- Store the resulting tag(s) as edge attributes in the graph, preserving which schema produced which tag.
Schemas recommended for early implementation: Social Change Map (roles), IAM Ecology taxonomy (integrative approaches), NCL Healthy Democracy taxonomy (civic orgs), Planetary Portal (global governance orgs).
Relationship inference
Beyond explicit relationships declared in source data, the graph can benefit from inferred relationships:
- Co-affiliation: two people who are both affiliated with the same organization have an implicit relationship worth surfacing
- Topical proximity: entities whose descriptions cluster together in embedding space are likely related, even if no explicit connection is documented
- Geographic co-location: entities operating in the same bioregion or city have contextually significant proximity
- Schema-based affinity: entities that share multiple category tags across multiple schemas have convergent positioning worth making explicit
Embedding generation
All entity records should be embedded after normalization and enrichment. The embedding vector enables semantic search and clustering.
- Option A: Nomic Atlas — upload records and compute embeddings through their managed service; the atlas visualization is a by-product
- Option B: sentence-transformers (local, free) — run embedding generation on your own infrastructure using models like all-MiniLM-L6-v2 or a domain-tuned variant
Geographic enrichment
For entities with location data, attach bioregion, watershed, and administrative boundary information. This enables geographic filtering and territory-aware recommendations.
- Use the One Earth bioregion schema as the primary bioregion taxonomy
- Geocode street addresses to coordinates using OpenStreetMap Nominatim (free) or Google Maps API
- Perform point-in-polygon lookups to assign bioregion and political entity memberships
5.4 Layer 4 — Store
The Store layer persists the normalized and enriched data in two complementary systems: a graph database for explicit entity-relationship data and a vector store for semantic search.
Graph database
A graph database is the natural fit for this data model because the primary value of the dataset is in the relationships between entities, not in the entities in isolation.
- Option A (recommended for most teams): Neo4j Community Edition — mature, well-documented, free for self-hosted single-server deployment. Strong Cypher query language, good visualization tooling, extensive community resources.
- Option B: SurrealDB — newer, more flexible schema model (supports graph + document + relational in one), more modern API, but less mature ecosystem. Good choice if you want to minimize infrastructure complexity.
- Option C: Apache AGE (Age Graph Extension for Postgres) — adds graph capabilities to Postgres, allowing you to keep a single database technology. Best if you are already committed to Postgres for staging storage.
- Option D: AD4M perspectives — if the infrastructure is built agent-centrically rather than server-centrically, AD4M perspectives provide a sovereign, RDF-native graph where each agent holds their own data and shares through neighbourhoods. This eliminates the central graph database entirely in favor of a federated model. This is architecturally more ambitious and departs from the server-hosted pipeline described in this document, but it may be the right long-term direction given the values of the ecosystem and the active development work at Coasys.
Vector store
The vector store holds embedding vectors for semantic search. It operates as a companion to the graph database rather than a replacement.
- Option A (recommended for self-hosted): Qdrant — purpose-built for vector search, well-documented, free and open source, Docker-deployable, supports payload filtering
- Option B: pgvector — Postgres extension; simplest if you are already running Postgres
- Option C: Chroma — lightweight, easy to get started, good for development; less battle-tested at scale
- Option D: Pinecone — fully managed, excellent performance, but has ongoing per-query costs
5.5 Layer 5 — Serve
The Serve layer exposes the stored data through a set of functions that can be consumed by any number of front-end applications or downstream services. The serve layer is deliberately defined in terms of functions rather than specific platforms, so that the same infrastructure can power multiple front-ends simultaneously.
Entity discovery and search
The most fundamental serving function: given a query (keyword, semantic description, or entity type filter), return matching entities with their attributes and relationships. This function underlies any directory, search interface, or recommendation feature.
- Implementation: GraphQL or REST API wrapping graph database queries, with semantic search as a secondary ranking signal from the vector store
Relationship traversal
Given a starting entity, return its neighbors to N degrees of separation, optionally filtered by relationship type, entity type, or attribute. This function underlies network visualization, adjacency discovery, and the “find people/orgs near this concept” use case.
- Implementation: Graph database traversal queries (Cypher for Neo4j); parameterized by depth, direction, and filter predicates
Categorization and tagging
Given an entity or a set of entities, return their category tags across one or more applied schemas. Enables filtering by role, approach, issue focus, or geographic scope.
- Implementation: Attribute lookup in the graph database; classification job results stored as edge attributes from entity to category node
Semantic similarity
Given an entity or a free-text description, return the most semantically similar entities in the graph. This is the core function for adjacency discovery, needs/offers matching, and synchronicity detection.
- Implementation: Vector store nearest-neighbor query using the embedding of the query entity or text; results joined with graph data for enriched response
Geographic query
Given a location, radius, or bioregion identifier, return entities present or operating in that area. Enables territorial views, bioregion dashboards, and locally-relevant coordination.
- Implementation: Geospatial query combining point-in-polygon lookups with graph traversal
Change feed and alerting
Emit events when new entities are ingested, when existing entities are updated, or when new relationships are inferred. Enables real-time coordination features and notification systems.
- Implementation: Database change data capture (CDC) with webhook delivery; n8n can serve as the event router
Export and federation
Allow partner organizations to pull entity data in standard formats (Murmurations profile JSON, CSV, JSON-LD). Enables the data to flow back out to the broader ecosystem, contributing to the commons rather than merely consuming from it.
- Implementation: Parameterized export endpoints; Murmurations profile generator for any entity type
AD4M’s neighbourhood model — where shared perspectives are synchronized peer-to-peer through pluggable link languages rather than pushed to a central endpoint — represents a more native implementation of this function than a Murmurations-style index, and is worth evaluating as the federation architecture matures.
5.6 Analytical Methodology: Mapping for Clarity and the GRASP Framework
The five technical layers described above (Ingest, Normalize, Enrich, Store, Serve) define how data moves through the infrastructure. This section addresses a complementary question: once data is flowing and the serving functions are operational, how should practitioners actually use this infrastructure to produce meaningful insight and action for the networks and communities it is meant to support?
The answer proposed here draws from the Mapping for Clarity (MfC) framework developed by Jim Ritchie-Dunham and described in Steve Waddell’s Global Action Networks (2011). MfC is a systems-based methodology for making complex networks legible — not just descriptively, but strategically, in a way that connects what participants care about to the leverage points where intervention would have the most effect. Its core analytical concept is GRASP:
- Goal — Why does the network exist?
- Resources — Which resources drive value for stakeholders, and which enable the work that creates that value?
- Actions — Which actions most effectively leverage the enabling resources?
- Structure — What are the linkages among the goals, resources, and actions?
- People — What do people care about in this system?
These five questions provide a structured lens for analyzing any network whose entities have been ingested and mapped. Rather than treating the data as a static directory, GRASP treats it as a dynamic system that can be interrogated to reveal misalignments, gaps, and leverage points.
Applying GRASP to the infrastructure
For each network, ecosystem, or use case surfaced by the infrastructure, practitioners can work through the GRASP elements using the data and tools already in the pipeline:
Goal: The categorization schemas applied in the Enrich layer (IAM metacrisis ecology taxonomy, Social Change Map, NCL Healthy Democracy schema) each encode an implicit theory of what networks in their domain are trying to achieve. Comparing a network’s stated goal (from its own profile data) against the goals implied by its categorization can surface divergence — organizations that believe they are doing one kind of work but whose relationships and activities cluster around another.
Resources: The entity graph contains both the value-driving resources (what stakeholders need from the network to remain engaged and participating) and the enabling resources (what makes the work possible). Relationship traversal functions can identify which entities are providing critical enabling resources — infrastructure, funding, knowledge, convening capacity — and which are underserved in their access to those resources. This is the foundation for needs/offers matching.
Actions: The semantic similarity function, in combination with the impact event ledger described in Section 2.5, can identify which types of actions are most strongly correlated with impact outcomes across comparable networks. Over time, as more networks log activity data, the infrastructure accumulates comparative evidence about which actions at which network positions tend to produce multiplier effects.
Structure: The relationship traversal function directly maps structural questions: who is connected to whom, at what degree of separation, through which intermediary nodes? Waddell’s analysis of the Global Reporting Initiative’s South Africa network illustrates how structural analysis reveals bridging organizations, isolated clusters, and under-connected stakeholder groups. The same analysis is available here for any network in the graph, using standard graph centrality measures (betweenness, closeness, degree) applied via Neo4j or SurrealDB queries.
People: This is the most qualitative element and the hardest to automate. The narrative layer of the impact data model — where entities can attach structured qualitative context to their activity records — is where “what people care about” lives. The embedding-based clustering in Nomic Atlas can surface thematic proximity between what different actors express as their motivations and values, even when they use different language to describe them.
Using GRASP to guide automation priorities
Not all automation work is equally valuable. GRASP provides a decision framework for prioritizing which automation pipelines to build or run first, based on which analytical question is most pressing for a given use case:
| Primary question | Most relevant pipeline component | Automation tool |
|---|---|---|
| What is this network for? (Goal) | Categorization batch jobs | LLM classification against IAM / Social Change Map schemas |
| Who has what the network needs? (Resources) | Semantic similarity + relationship traversal | Nomic Atlas embeddings + Neo4j traversal |
| What works? (Actions) | Impact event aggregation | n8n-triggered aggregation queries + impact ledger |
| Who connects to whom? (Structure) | Graph centrality analysis | Neo4j graph algorithms library |
| What do people care about? (People) | Qualitative clustering | Nomic Atlas on narrative / description fields |
The visual diagnostics dimension
Waddell’s chapter situates GRASP within a broader toolkit of visual diagnostic methods — issue crawls, social network analysis, value network analysis, concept mapping, and geo mapping — each suited to different aspects of network complexity. The serving functions described in Section 5.5 map directly onto these methods:
- Entity discovery and search → issue crawl analogue (identifying who is in the arena)
- Relationship traversal → social network analysis
- Geographic query → geo mapping
- Semantic similarity → concept mapping (surfacing conceptual proximity)
- Categorization and tagging → value network analysis (assigning roles and exchange types)
This alignment means the infrastructure is not merely a data store but a platform for conducting the full range of visual diagnostic analysis that Waddell describes — with the significant advantage that the data is continuously updated rather than gathered in a one-time survey. Networks can be analyzed at a point in time and then re-analyzed periodically, making it possible to observe whether interventions aimed at structural gaps are having the intended effect.
Serving users, organizations, and communities
The practical intent of applying GRASP through this infrastructure is to improve three types of outcome, which correspond to the three levels of the Serve layer:
For individual users and contributors: connecting people to resources, collaborators, and opportunities they would not have found independently. The semantic similarity and geographic query functions are the primary mechanisms here. The goal is to reduce the coordination friction that currently means that people working on similar problems in adjacent networks often do not find each other until years into their work, if at all.
For organizations and projects: helping leadership understand where their organization sits in the broader network, what structural gaps they might be positioned to fill, and which potential partners have complementary capabilities. The relationship traversal and categorization functions support this. The GRASP framework provides the analytical structure that turns these data points into strategic recommendations rather than mere information.
For communities and ecosystems: enabling the kind of systemic self-understanding that Waddell documents as transformational — where participants shift from asking “what can they give me” to “how can what I do make them successful as well?” The MfC methodology achieves this by making the whole system visible to all its participants simultaneously. This infrastructure makes that visibility persistent and updatable, rather than dependent on a one-time participatory mapping event. It bears emphasis that Waddell documents this systemic self-understanding as the product of facilitated participatory processes — issue crawls, multi-stakeholder convenings, skilled facilitation over time. The infrastructure provides the data layer that makes those processes more informed and their outputs more durable. It does not replace the processes themselves.6
6. References
This section lists the primary sources cited or drawn upon across this report, organized by category. Sources are given in a format suitable for academic or professional citation. URLs are provided where openly accessible versions are available.
6.1 Books and Reports
Bauwens, M., & Niaros, V. (2016). Value in the commons economy: Developments in open and contributory value accounting. Heinrich Böll Foundation. https://www.boell.de/en/2017/02/01/value-commons-economy-developments-open-and-contributory-value-accounting
Conaty, P., & Bollier, D. (2016). Democratic money and capital for the commons. Commons Strategies Group / Heinrich Böll Foundation. https://www.boell.de/en/2016/01/15/democratic-money-and-capital-commons
Field, J. (2026, March). A digital nervous system for the wise web. Coasys. [Medium article] https://medium.com/coasys/a-digital-nervous-system-for-the-wise-web
Lightfoot, J. (2021). The liminal web: Mapping an emergent subculture of sensemakers, meta-theorists, and systems poets. joelightfoot.org. https://www.joelightfoot.org/post/the-liminal-web-mapping-an-emergent-subculture-of-sensemakers-meta-theorists-systems-poets
Nørgaard, B., Hedlund, N., & Meglin, C. (2025). Mapping an ecology of integrative approaches to addressing the metacrisis. Institute of Applied Metatheory. https://appliedmetatheory.org/mapping-ecology-integrative-approaches-addressing-metacrisis/
Nørgaard, B. (2025). Report on liminal web ecosystem networking and mapping. Institute of Applied Metatheory. https://coda.io/d/Report-on-Liminal-Web-Ecosystem-Networking-and-Mapping-public-ve_d1X6mvo57yO
Owocki, K. (2024). Onchain capital allocation handbook. Allo/Gitcoin. https://allobook.gitcoin.co
Owocki, K., Stringer, D., & Ospina, D. (2025). The networked firm: Capital allocation in the age of blockchain and AI. Allo Capital.
Power, S., & Seefeld, L. (2024). Bioregional financing facilities: Reimagining finance to regenerate our planet. BioFi Project / Dark Matter Capital Systems. https://www.biofi.earth
Smith, R. (2025). A sociology of big pictures: Network strategy for a 21st century worldview. Institute of Applied Metatheory. https://appliedmetatheory.org/a-sociology-of-big-pictures/
Waddell, S. (2011). Global action networks: Creating our future together. Palgrave Macmillan. [Chapter 4, “Seeing the Whole,” is the primary source for the GRASP / Mapping for Clarity framework cited in Section 5.6 of this report.]
6.2 Data Sources and Ecosystem Maps
The following are the primary data sources and ecosystem maps referenced in Section 3. Full descriptions and access methods are provided in that section; this list provides citation-style references.
Bauwens, M. (Ed.). P2P Foundation Wiki. https://wiki.p2pfoundation.net [Ongoing; MediaWiki API available at wiki.p2pfoundation.net/api.php]
Berggruen Institute. Planetary Portal. https://planetaryportal.org
Bowen, C. Decentralized tech ecosystem map. Kumu. https://kumu.io/DigLife/decentralized-tech
Civic Hall. Civic Tech Guide. https://civictech.guide
de Graf, B. NooNAO. https://nao.is
de Graf, B., & Standingwave. Standingwave bioregional map. https://standingwave.net/apps/mapbox/
Ecovillage Network / Joubert, K. Global ecovillage map. https://ecovillage.org/ecovillages/map/
Iyer, D. The Social Change Map. https://www.socialchangemap.com
Life Itself. Second Renaissance ecosystem map. https://secondrenaissance.net/ecosystem/cohere/map
Lindenberger, D. Thaumazo community mycelium. https://thaumazo.org/projects/community-mycelium
National Civic League. Healthy Democracy Ecosystem Map. https://www.nationalcivicleague.org/2024-healthy-democracy/
One Earth. One Earth bioregion navigator. https://www.oneearth.org/navigator/
ReFi DAO. ReFi Ecosystem. https://www.refidao.com/ecosystem
Restor. Restor ecological restoration map. https://restor.eco
Roote. Wisdom Age. https://www.roote.co/wisdom-age
Schull, J. Big Map to Save the Future. https://bigmaptosavethefuture.net
Sloww. Meta-Crisis Meta-Resource. https://metacrisis.org
Terran Collective. Hylo. https://www.hylo.com
Weavers. Weavers Social Trust Map. https://trust.weavers.org
6.3 Tools and Platforms
The following tools and platforms are referenced in Sections 4 and 5. References are to project homepages and, where available, technical documentation.
| Tool / Platform | Role in report | Reference |
|---|---|---|
| n8n | Workflow orchestration (Ingest / Normalize layers) | n8n.io · docs.n8n.io |
| Murmurations | Protocol-native ingest and federation | murmurations.network · docs.murmurations.network |
| Nomic Atlas | Embedding generation and semantic clustering | atlas.nomic.ai · docs.nomic.ai |
| Kumu | Graph visualization; JSON export source | kumu.io · docs.kumu.io |
| HuViz | RDF / SPARQL graph traversal interface | smurp.github.io/huviz |
| Neo4j | Graph database (Store layer, Option A) | neo4j.com · neo4j.com/docs |
| SurrealDB | Graph database (Store layer, Option B) | surrealdb.com · surrealdb.com/docs |
| Apache AGE | Graph extension for Postgres (Store layer, Option C) | age.apache.org |
| Qdrant | Vector store (Store layer, Option A) | qdrant.tech · qdrant.tech/documentation |
| pgvector | Postgres vector extension (Store layer, Option B) | github.com/pgvector/pgvector |
| Chroma | Vector store (Store layer, Option C) | trychroma.com |
| Pinecone | Managed vector store (Store layer, Option D) | pinecone.io |
| Obsidian | Personal knowledge graph; contributor authoring tool | obsidian.md |
| Roam Research | Personal knowledge graph; contributor authoring tool | roamresearch.com |
| IAM Context | Conceptual framework mapping and categorization | contextdriven.ai |
| ArcGIS / Esri | Geospatial data layers; geographic enrichment | esri.com/arcgis |
| Restor API | Land-based project and restoration data | restor.eco |
| OpenStreetMap Nominatim | Geocoding (free tier) | nominatim.openstreetmap.org |
| Make (Integromat) | Cloud workflow orchestration alternative | make.com |
| Supabase | Managed Postgres (staging storage) | supabase.com |
| Fly.io | Cloud deployment; managed Postgres | fly.io |
| RapidFuzz | Python fuzzy string matching (deduplication) | github.com/maxbachmann/RapidFuzz |
| sentence-transformers | Local embedding generation (Python) | sbert.net |
| Catalist | Network coordination platform; data source | catalist.network |
| Bright Data | Web scraping infrastructure (if needed at scale) | brightdata.com |
6.4 Standards, Protocols, and Identity Infrastructure
The following standards and identity infrastructure tools are referenced in the report’s treatment of digital identity, proof of personhood, and federation (Sections 2.6, 4.7, and 5.4).
W3C. (2022). Decentralized identifiers (DIDs) v1.0. https://www.w3.org/TR/did-core/
W3C. (2022). Verifiable credentials data model v1.1. https://www.w3.org/TR/vc-data-model/
W3C. (2017). Resource Description Framework (RDF). https://www.w3.org/RDF/
W3C. (2013). SPARQL 1.1 query language. https://www.w3.org/TR/sparql11-query/
W3C. (2017). Shapes Constraint Language (SHACL). https://www.w3.org/TR/shacl/
Murmurations Protocol. Murmurations network index and profile schema specification. https://murmurations.network
SpruceID. Open-source DID and verifiable credentials tooling. https://spruceid.com
Veramo. JavaScript framework for DIDs and verifiable credentials. https://veramo.io
Solid Project. Personal data pods specification (Berners-Lee). https://solidproject.org
cheqd. Blockchain-based credential network. https://cheqd.io
6.5 Impact Measurement Frameworks
The following frameworks are referenced in the report’s treatment of multi-dimensional impact measurement (Sections 2.5 and 4.7).
Global Impact Investing Network (GIIN). IRIS+ impact measurement system. https://iris.thegiin.org
United Nations. Sustainable Development Goals (SDGs). https://sdgs.un.org/goals
R3.0. (2020). From monocapitalism to multicapitalism: 21st century system value creation (Baue, W.). https://www.r3-0.org
6.6 Key Organizations and Initiatives Referenced
The following organizations and initiatives are named in this report in the context of use cases, data partnerships, or ecosystem relationships. This list is provided for reference; it is not exhaustive.
| Organization / Initiative | Role in report | URL |
|---|---|---|
| Institute of Applied Metatheory (IAM) | Sponsor of original liminal web mapping research; IAM metacrisis ecology taxonomy; Context platform | appliedmetatheory.org |
| Eudaimonia Institute | Operations partner; Strategic Metacrisis Mapping Initiative | eudaimoniainstitute.org |
| Civilization Research Institute (CRI) | Metacrisis research; potential connection to use case 2.5 | civilizationresearchinstitute.org |
| OpenHaven | Primary use case (DWeb / P2P technology mapping) | openhaven.net |
| Better Together America (BTA) | Civic hub network; primary use case (civic coordination layer) | bettertogetheramerica.org |
| Mediators Foundation (MF) | Institutional partner for Civic Intelligence Infrastructure | mediatorsfoundation.org |
| Life Itself | Second Renaissance ecosystem map; Cohere platform | secondrenaissance.net |
| Coasys | AD4M semantic web runtime | github.com/coasys/ad4m |
| BioFi Project | Bioregional Financing Facilities framework and tooling | biofi.earth |
| MetaGov | Digital governance research; CII ecosystem partner | metagov.org |
| Hylo / Terran Collective | Tier 1 data source; GraphQL API; regenerative community platform | hylo.com |
| National Civic League | Healthy Democracy Ecosystem Map; categorization schema | nationalcivicleague.org |
| P2P Foundation | Tier 1 data source; MediaWiki API; Michel Bauwens | wiki.p2pfoundation.net |
| NooNAO / Brad de Graf | Bioregional mapping; World Wise Web network | nao.is |
| Thaumazo | Bioregional community mycelium; partnership data source | thaumazo.org |
Footnotes
-
This document describes what data flows through a pipeline and what functions that pipeline can serve. It does not model why actors would change their behavior as a result of having access to those functions, who would do the facilitation work of acting on the data, or how sustained contributor engagement would be achieved and maintained. These are not technical questions — they are organizational and relational ones. The companion documents address them directly: Mapping Infrastructure should be read alongside the Peerfunding and Commons-Based Finance Reference Taxonomy and the companion document Funding the Commons in Practice, which together address the human coordination layer this architecture requires. ↩
-
The liminal web and civic technology ecosystem has been mapped multiple times: Joe Lightfoot’s Liminal Web map (2021), Life Itself’s Second Renaissance Ecosystem Map, the IAM Ecology of Integrative Approaches, Catalist, Hylo, and NooNAO all exist and are partially or fully publicly accessible. The coordination gaps described in this use case have persisted despite those resources. This does not mean mapping infrastructure has no value — it means that infrastructure alone is not sufficient and that the binding constraint is more likely the facilitation layer than the data layer. The question to hold is: what would coordinators do differently with this infrastructure that they are not doing now, and what prevents them from doing it today? ↩
-
The scenario described in this use case — co-located organizations unaware of each other — is becoming less common as regional regenerative networks mature. The more typical coordination failures in regenerative ecosystems are: resource competition between organizations applying to the same funders with overlapping scopes; governance incompatibility between groups with different decision-making cultures; and substantive disagreement about theories of land stewardship, indigenous knowledge sovereignty, or regenerative practice that are not resolved by mutual awareness. Infrastructure that surfaces these tensions more clearly is valuable — but it should be understood as making existing conflicts legible rather than dissolving them. ↩
-
Steve Waddell’s analysis of Global Action Networks in Global Action Networks: Creating Our Future Together (2011) documents organizations like the Global Reporting Initiative, the Forest Stewardship Council, and the Marine Stewardship Council. These networks emerged from years of sustained multi-stakeholder engagement, diplomatic relationship-building, and organizational development — not from improved data discoverability. The mapping infrastructure described in this document can support GAN formation by making potential participants visible to each other and by providing shared analytical infrastructure. It cannot substitute for the relational and political work that Waddell identifies as the actual mechanism of GAN emergence. This use case should be understood as a long-horizon aspiration dependent on substantial facilitation investment rather than a near-term infrastructure output. ↩
-
The claim that infrastructure can identify which interventions address root causes versus symptoms implies a level of causal knowledge about complex systems that does not currently exist as a computable artifact. LLM-based classification against categorization schemas — the mechanism described in the Enrich layer — can identify how actors describe and frame their own work, and can surface convergences and divergences in how different schemas categorize the same entity. It cannot adjudicate between competing theories of change or determine actual causal pathways in complex social systems. The revised language in the main text (“framed as addressing causes versus symptoms by the actors and schemas represented in the data”) reflects what the system can actually produce. ↩
-
The shift Waddell documents — from “what can they give me” to “how can what I do make them successful” — is described in Global Action Networks as the product of what he calls “Mapping for Clarity” processes: structured, facilitated multi-stakeholder engagements in which all participants see the whole system simultaneously and work through the GRASP elements together. These are not data analysis sessions — they are relational and deliberative processes that happen to be informed by data. The infrastructure described in this document makes those processes more analytically rigorous and their outputs more persistent and updatable. It does not make them less necessary. ↩